Estimated savings are a starting point
Every lighting upgrade comes with a savings estimate, and most estimates are reasonable. Very few are checked after the project, and the ones that are often turn out different. Sensors were set to longer delays than designed, a second shift appeared, a daylight zone was never enabled. Without measurement, nobody knows whether the project delivered, or which settings to fix.
The decision here is how much measurement your building needs: enough to catch faults, enough to satisfy an incentive program or financing partner, or a full M&V plan with a contractual baseline.
Metering where the data already exists
Lytbit Ledger is a fixture- and zone-level energy ledger. How much detail it holds depends on what the hardware can report:
| Source | Resolution | Measured or calculated | When we use it |
|---|---|---|---|
| Luminaire-level controls with metering; D4i drivers | Per fixture | Usually measured; we verify | LLLC and newer DALI-2 projects |
| Networked controls reporting by zone | Per zone or group | Either, depending on the platform | Most networked control systems |
| Branch-circuit meters on lighting panels | Per circuit | Measured | Older systems, unmetered 0-10V, spot verification |
| Utility interval data | Whole building | Measured | Context and reconciliation, not attribution |
Our rule is to label every number with where it came from. A value calculated from rated wattage and dimming level is useful, but it shouldn’t be presented as a meter reading. The metering map shows which is which, so nobody is surprised during a review. Where a platform reports only estimates and the savings have to stand up to scrutiny, we meter a sample of circuits and check the estimates against them.
A baseline you agree to before the work
Savings are the difference between what you used and what you would have used without the project. That second number never appears on a meter, so it has to be agreed in advance. We follow an IPMVP-style approach:
- Set the measurement boundary: the lighting circuits, specific zones or the whole facility.
- Establish the baseline. Measure before the retrofit where the schedule allows; otherwise reconstruct it from the fixture inventory, wattages and logged or surveyed operating hours.
- Define adjustments. Changes in operating hours, occupancy, added floor area or new shifts are handled by formula, not argued about later.
- Report uncertainty honestly. A savings figure with a stated range is more credible than a precise one.
Isolating the lighting suits most of our projects. Whole-facility comparisons work only when lighting is a large share of the load and little else changes.
Fault detection that earns its keep
Ledger Watch looks for the expensive failures, which are rarely dramatic:
- lights on at 2 a.m. in zones that report no occupancy;
- a sensor reporting occupied for days without a break;
- overrides that should have timed out and didn’t;
- a daylight zone holding full output on a bright afternoon;
- gateways or controllers offline;
- D4i driver faults and failed fixtures.
Each alert links to the zone on the floor plan and, under a support plan, opens a ticket.
Demand flexibility through OpenADR 3.0
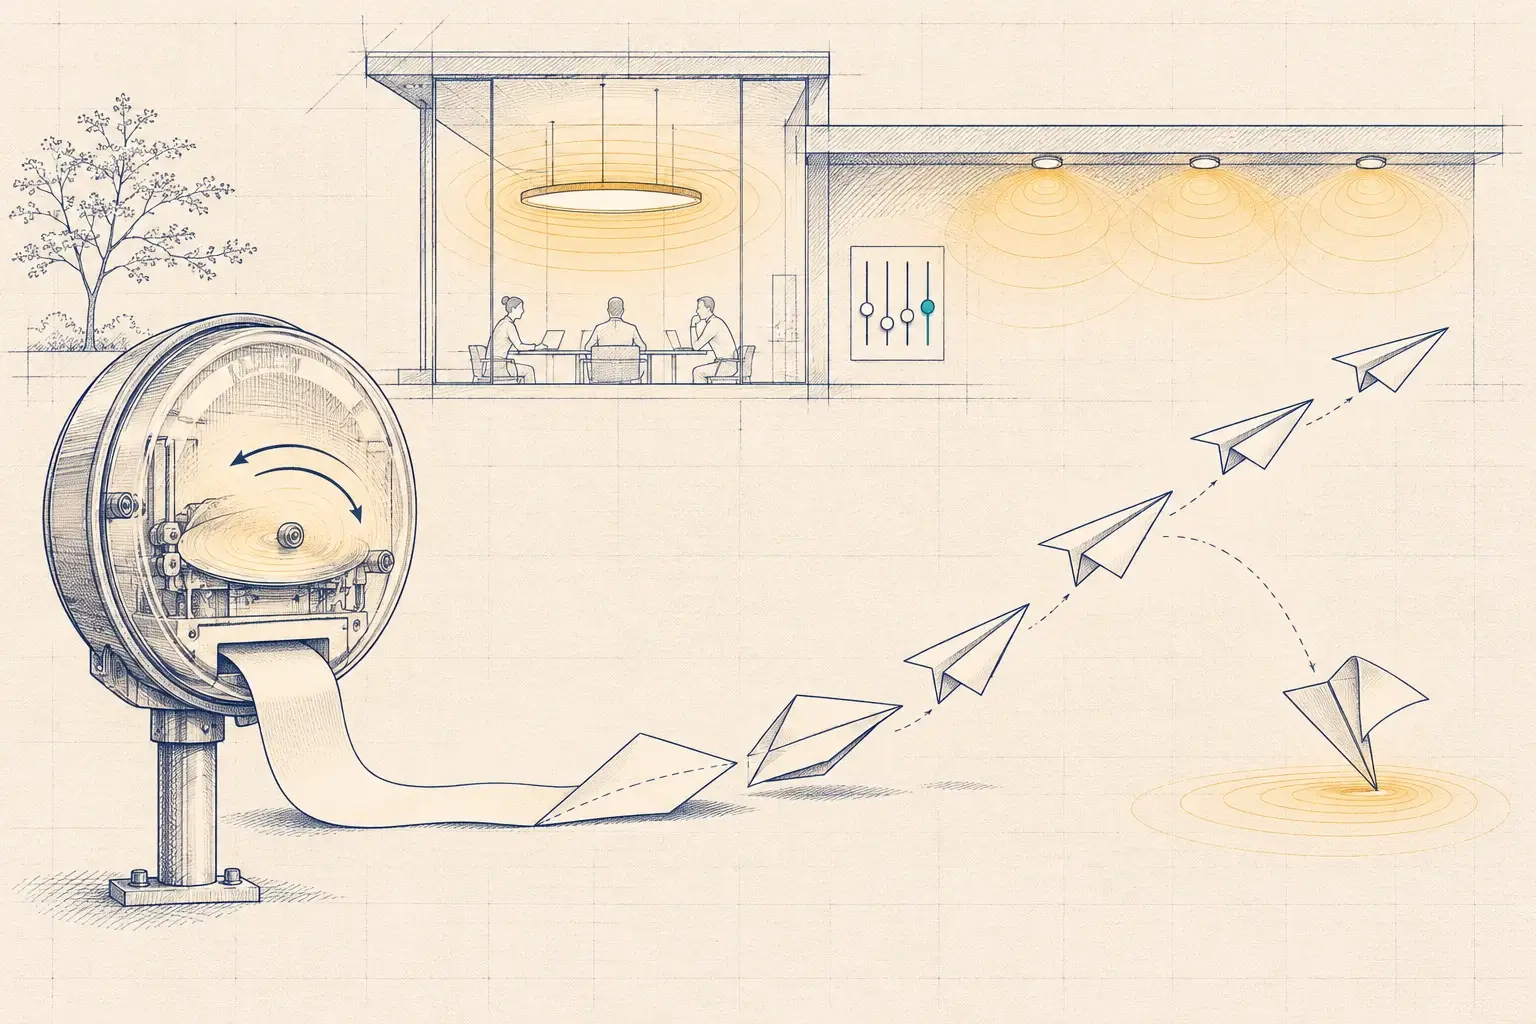
Lighting is a good flexible load: dimming a corridor or warehouse aisle for an hour is rarely noticed. Ledger Flex receives events through OpenADR 3.0, applies the shed levels you set per zone, then restores and records the result. Where your utility or an aggregator runs a program, you can enroll. Where none exists yet, the same capability lets you trim your own peaks. The 2024 IECC includes functional testing of demand-responsive controls where they’re installed, which our commissioning covers.
Reports people actually use
Ledger Reports formats the same data for different readers: monthly savings for finance, documentation for incentive programs, and meter data ready to upload to ENERGY STAR Portfolio Manager.