Connect & Integrate

Occupancy and space analytics

Badge data says who came in. The booking system says who reserved a room. Neither says which spaces were actually used. We measure that anonymously, starting with sensors you may already own, and turn it into decisions about leases, cleaning and HVAC.

ProjectLytbit · Smart lighting & IoT
SheetE-11
Rev26.11
DisciplineSpace Analytics
DrawnLytbit Engineering
Scale1 : 1
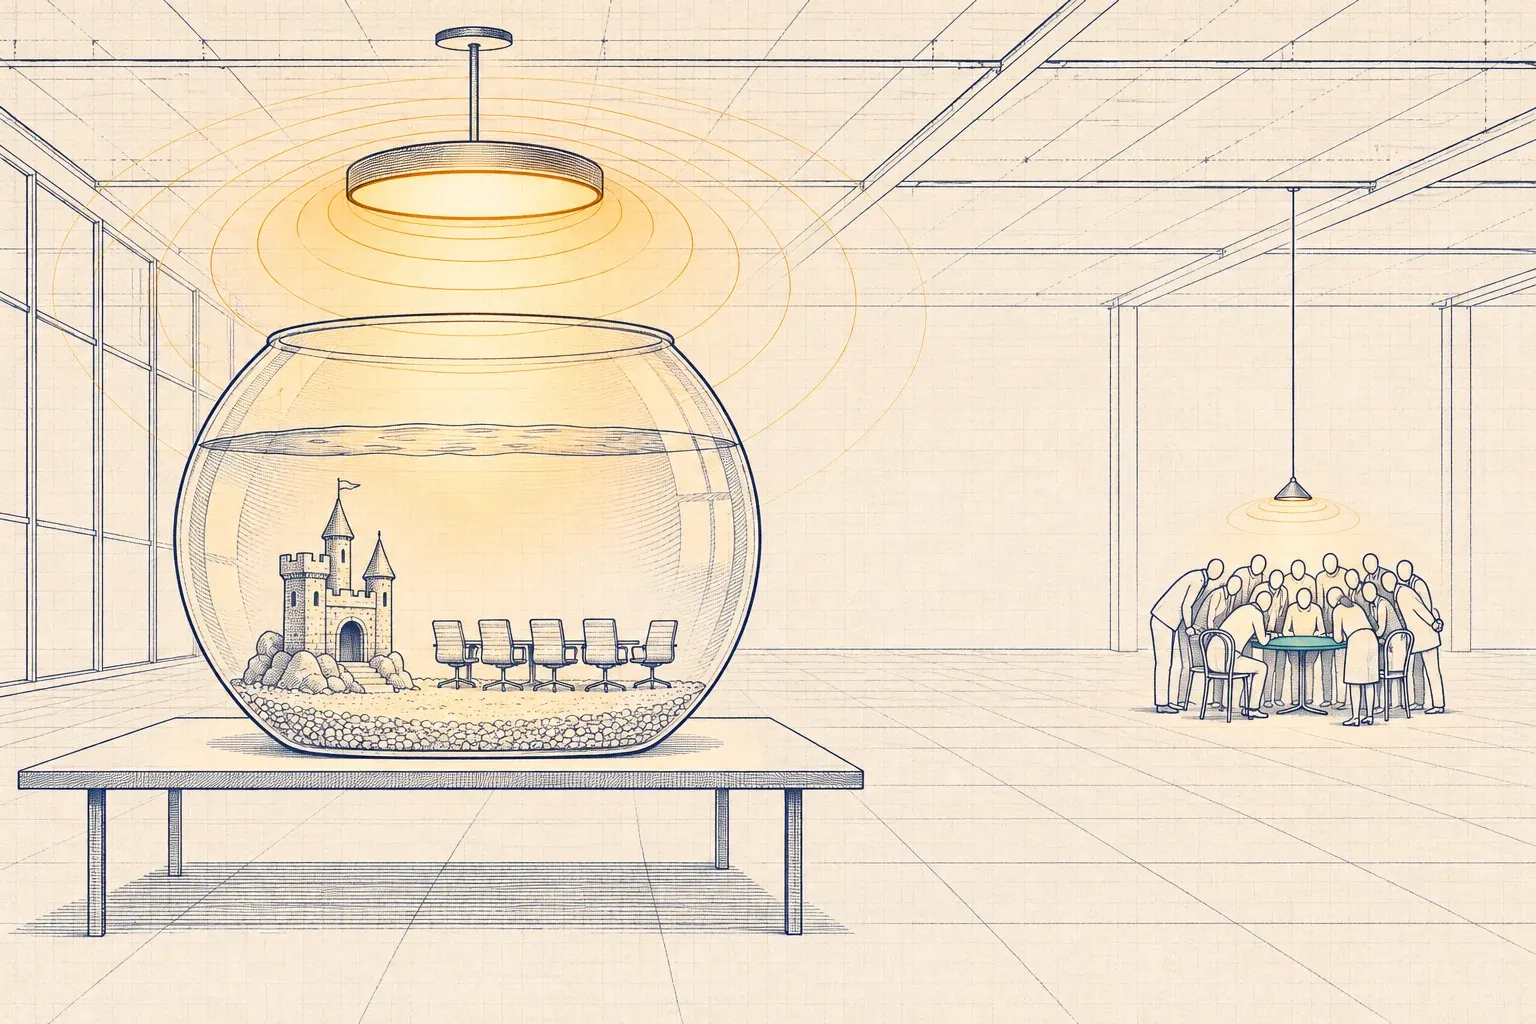
An empty fishbowl shaped like a glass conference room sits under a bright ceiling light, while across the floor a crowd of small figures squeezes around one tiny cafe table.
Plate E-11The most expensive room in the building is often the empty one with the lights on.

What changes when we're done

Anonymous occupancy and utilization data from lighting sensors and people counters, turned into decisions on space, cleaning and HVAC.

  • A measured picture of which spaces are used, how often and by how many, rather than which ones are booked
  • Evidence for lease and layout decisions in hand before the renewal date
  • Cleaning and HVAC schedules that follow actual use
  • Privacy by design: anonymous counts, and no cameras unless you specifically choose them

What's included

Every engagement is scoped to the building, but these are the parts we won't skip.

E-11.01

Sensor audit

We check what your lighting platform already reports, how often and at what resolution. Occupancy from networked lighting controls is often data you're already paying to collect and never read.

E-11.02

People counters where they matter

Where you need headcount rather than presence, we add dedicated anonymous counters, such as thermal, time-of-flight or radar sensors over doorways and tables, chosen for accuracy in that space type.

E-11.03

Clear definitions

We define occupancy, vacancy and utilization for your portfolio in writing, so a percentage means the same thing in every report and every building.

E-11.04

Ledger Space

Utilization by space type, floor, hour and weekday in the Ledger Space module of Lytbit Ledger, with exports as CSV, through the API or over MQTT for your workplace or real-estate tools.

E-11.05

Privacy design

No cameras by default, no tracking of individuals, and no badge, phone or Wi-Fi identifiers. We document what's collected, how long it's kept and who can see it.

E-11.06

Decision reviews

Sessions on the cadence you choose, where we turn the data into actions: rooms to repurpose, floors to consolidate, cleaning routes to change.

How it works

The same steps on every project, so you always know what happens next and what you'll receive.

  1. Frame the decision

    A lease renewal, a consolidation, a cleaning contract or HVAC savings. The decision sets the sensor resolution, the spaces that matter and the study length.

  2. Inventory and gaps

    We map existing sensors to spaces and mark where presence data is enough and where you need counts.

  3. Bench and install

    New counters are tested in the Lytbit Lab for accuracy and network behavior, then installed with privacy settings fixed at onboarding.

  4. Calibrate

    We check sensor data against manual observation in sample spaces and correct for lighting time delays.

  5. Measure and report

    A baseline study runs through enough normal weeks to capture real variation, then reporting continues on the cadence you need.

You receive

Deliverables

  • Space inventory with capacity, type and sensor coverage
  • Definitions sheet: occupancy, vacancy, headcount, utilization, peak and frequency
  • Privacy statement for the deployment, written for your HR and legal teams
  • Utilization study report with recommendations
  • Ongoing Ledger Space access and data exports

How it's scoped

A fixed-fee utilization study, optionally followed by a Ledger Space subscription scoped by floor area and sensor count

  • Studies that use only your existing lighting sensors are scoped smaller, because there's no hardware to buy or install.
  • People counters can be purchased outright or included in the subscription.
  • Ongoing reports and decision reviews can be added to a support plan.

Good fit if

Who this is for

  • A lease renewal or consolidation decision is coming within the next year or two
  • Meeting rooms are always booked but often look empty
  • Your cleaning contract cleans every space every night, regardless of use
  • You already have networked lighting sensors and want more out of them

Booked is not the same as used

Most organizations size their space from three numbers: headcount, the lease and the room-booking calendar. None of them measures use. Booked rooms sit empty when meetings move online. Assigned desks stay dark three days a week. Meanwhile the four-person huddle rooms are full all day and people take calls in the stairwell.

The question to settle is whether, and how, to measure real space use before your next space decision: a lease renewal, a consolidation, a cleaning contract or an HVAC schedule.

Occupancy, vacancy and utilization are different things

These words get used interchangeably, and that leads to bad conclusions. We define them at the start of every engagement:

Term What it measures Typical source Good for
Occupancy (presence) Whether anyone is in a zone, yes or no Lighting occupancy sensors “Is this room ever used?” and HVAC setback
Vacancy How long a space sits empty The same sensors, read the other way Skipping cleaning, after-hours sweeps
Headcount How many people are present Dedicated people counters Meeting-room sizing, cafe and lobby capacity
Utilization Use relative to capacity, over time Presence or counts, plus a space inventory Lease and layout decisions

In lighting, “vacancy” also names a sensor mode: manual on, automatic off. In analytics we use it for empty time, and the definitions sheet says so.

A room can be occupied most of the day and still be poorly utilized, if a twelve-seat room hosts one person on calls. That’s the finding that changes leases, and presence data alone can’t see it.

Your lighting sensors are a head start, with a bias

If you have networked lighting controls, there’s already an occupancy sensor in most rooms. That data is effectively free, and we use it first. It has one known bias: lighting sensors hold the lights on for a time delay after the last motion. With a 15-minute delay, a two-minute visit reads as a 17-minute meeting. We correct for this by working from sensor events rather than light state wherever the platform exposes them, and by checking against manual counts in sample rooms.

Where you need headcount, we add dedicated counters only in the spaces that matter for the decision, such as meeting rooms, collaboration areas and entrances, rather than covering the whole building.

Privacy, stated plainly

Occupancy data is about people, so we treat it carefully even when it’s anonymous:

  • No cameras by default. We use thermal, time-of-flight or radar counters that report numbers, not images.
  • No individual tracking. We don’t collect badge IDs, phone identifiers or Wi-Fi addresses.
  • Aggregated by space and time. Reports show rooms and hours, never people.
  • Written down. Each deployment gets a short privacy statement your HR and legal teams can review before anything is installed.

What you do with it

  • Right-size the lease. Utilization by floor and space type, measured over normal weeks, shows how much space you’d keep if you renewed tomorrow. Bring it to the negotiation, not after it.
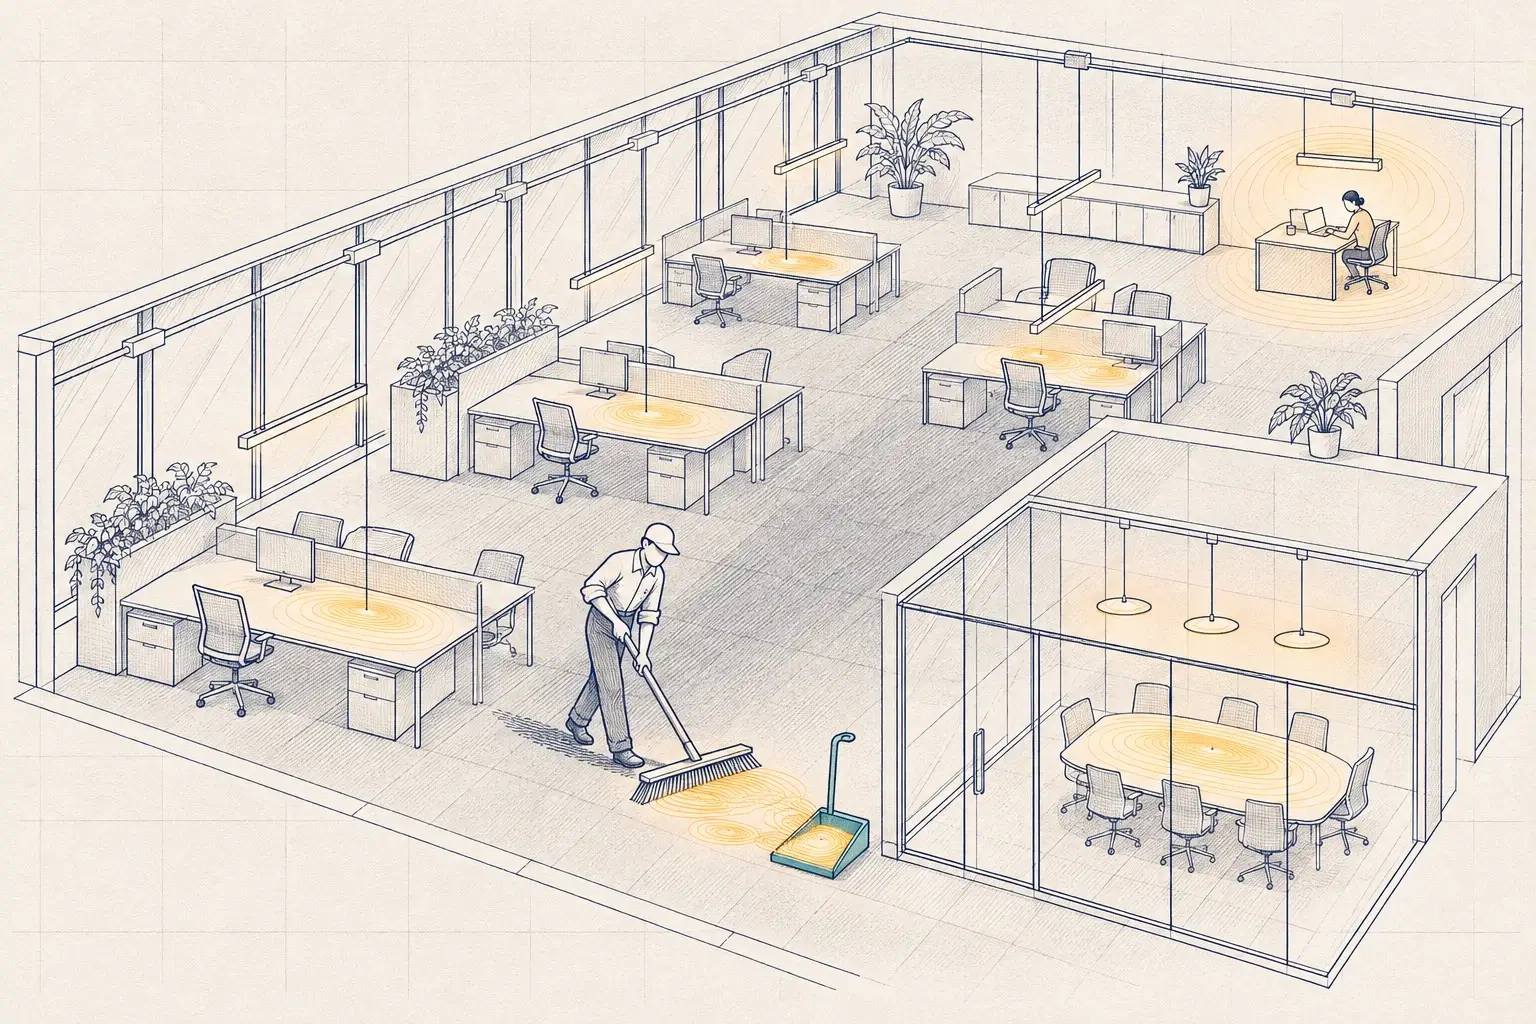
  • Clean what was used. Vacancy data lets crews skip rooms nobody entered and spend the time on the ones that were busy.
  • Condition what’s occupied. The same presence data drives occupied-standby HVAC setback through BMS integration.
  • Fix the mix. If huddle rooms are full and boardrooms are empty, the answer is a construction drawing, not a booking policy.

How it’s delivered

Data flows into the Ledger Space module of Lytbit Ledger, where you can view utilization by space type, floor, hour and weekday, and export it as CSV, through the API or over MQTT. If you’re adding new sensors, see IoT integration. If you’re planning a PoE lighting project, its sensors can feed the same layer from the first day.
FAQ

Questions we hear often

Still unsure? Write to sales@lytbit.com and a person will answer within one business day.

Can we use our lighting sensors, or do we need new hardware?

Start with what you have. Networked lighting occupancy sensors give presence by zone, which answers "is this room ever used?" well. They don't count people, and their time delays make visits look longer than they were. Where you need headcount, add dedicated counters only in the spaces that matter for the decision.

Do you use cameras?

Not by default. Thermal, time-of-flight and radar counters report counts without capturing images of people. If you have a specific reason to want camera-based analytics, we discuss it with your legal and HR teams first and choose devices that process images on the sensor, so only counts ever leave it.

Can the data identify individuals?

The sensors we use by default record presence or counts per space, not who was there. We don't collect badge, phone or Wi-Fi identifiers. Data is aggregated by space and time, hosted in the US and owned by you.

How long does a study take?

Long enough to capture normal variation. For most offices, plan on several weeks of ordinary operation, avoiding holiday periods and one-off events. If your use is seasonal, as in schools, we measure the season that matters to the decision.

How does this connect to HVAC?

The same presence data can switch HVAC zones to occupied-standby when they're empty. See BMS integration for how we share it with your building automation system or thermostats.

A space decision coming up?

Tell us the decision and the date. We'll tell you what to measure, for how long, and whether your existing sensors can do it.